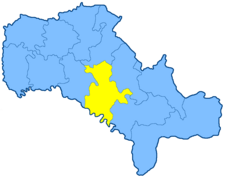
Yampol uezd
Appearance
Yampol uezd
Ямпольскій уѣздъ | |
|---|---|
 Location in the Podolia Governorate | |
| Country | Russian Empire |
| Krai | Southwestern |
| Governorate | Podolia |
| Established | 1795 |
| Abolished | 1923 |
| Capital | Yampol |
| Area | |
• Total | 3,618.01 km2 (1,396.92 sq mi) |
| Population (1897) | |
• Total | 266,300 |
| • Density | 74/km2 (190/sq mi) |
| • Urban | 2.48% |
| • Rural | 97.52% |
The Yampol uezd[a] was a county (uezd) of the Podolia Governorate of the Russian Empire. It bordered the Vinnitsa uezd to the north, the Bratslav and Olgopol uezds to the east, the Soroka uezd to the south, and the Mogilev uezd to the west. The district was eponymously named for its administrative center, Yampol (modern-day Yampil).
Administrative divisions
The subcounties (volosts) of the Yampol uezd in 1912 were as follows:[1]
| Name | Name in Russian | Capital |
|---|---|---|
| Babchintsy volost | Бабчинецкая волость | Babchintsy |
| Velikaya Kosnitsa volost | Велико-Косницкая волость | Velikaya Kosnitsa |
| Dzygovka volost | Дзыговская волость | Dzygovka |
| Klembovka volost | Клембовская волость | Klembovka |
| Komar-Gorod volost | Комаръ-Городская волость | Komar-Gorod |
| Krasnoe volost | Краснянская волость | Krasnoe |
| Murafa volost | Мурафская волость | Murafa |
| Penkovka volost | Пеньковская волость | Penkovka |
| Rozhnyatovka volost | Рожнятовская волость | Rozhnyatovka |
| Timanovskaya volost | Тимановская волость | Lipovka-Timanovskaya |
| Tomashpol volost | Томашпольская волость | Tomashpol |
| Chernovtsy volost | Черновецкая волость | Chernovtsy |
| Yampol volost | Ямпольская волость | Yampol |
| Yaruga volost | Яругаская волость | Yaruga |
Demographics
At the time of the Russian Empire Census on 28 January [O.S. 15 January] 1897, the Yampol uezd had a population of 266,300, including 131,330 men and 134,970 women. The majority of the population indicated Little Russian[b] to be their mother tongue, with a significant Jewish speaking minority.[4]
| Language | Native speakers | Percentage |
|---|---|---|
| Little Russian[b] | 228,102 | 85.66 |
| Jewish | 27,744 | 10.42 |
| Great Russian[b] | 4,966 | 1.86 |
| Polish | 4,716 | 1.77 |
| German | 586 | 0.22 |
| Romanian | 50 | 0.02 |
| Czech | 39 | 0.01 |
| French | 26 | 0.01 |
| Gipsy | 23 | 0.01 |
| White Russian[b] | 10 | 0.00 |
| Mordovian | 3 | 0.00 |
| Tatar | 3 | 0.00 |
| Latvian | 2 | 0.00 |
| Votyak | 1 | 0.00 |
| Other | 29 | 0.01 |
| Total | 266,300 | 100.00 |
Notes
- ^
- ^ a b c d Prior to 1918, the Imperial Russian government classified Russians as the Great Russians, Ukrainians as the Little Russians, and Belarusians as the White Russians. After the creation of the Ukrainian People's Republic in 1918, the Little Russians identified themselves as "Ukrainian".[2] Also, the Belarusian Democratic Republic which the White Russians identified themselves as "Belarusian".[3]
References
- ^ Волостныя, станичныя, сельския, гминныя правления и управления, а также полицейские станы всей России с обозначением места их нахождения [Volostny, stanichnaya, rural, communes of government and administration, as well as police camps throughout Russia with the designation of their location]. Kiev: Izd-vo T-va L. M. Fish. 1913. p. 162. Archived from the original on 2022-12-11.
- ^ Hamm, Michael F. (2014). Kiev: A Portrait, 1800–1917. Princeton University Press. p. 83. ISBN 978-1-4008-5151-5.
- ^ Fortson IV, Benjamin W. (2011). Indo-European Language and Culture: An Introduction. John Wiley & Sons. p. 429. ISBN 978-1-4443-5968-8.
- ^ a b "Демоскоп Weekly - Приложение. Справочник статистических показателей". www.demoscope.ru. Retrieved 2019-12-19.

