Reno County, Kansas
Reno County | |
|---|---|
 Reno County Courthouse in Hutchinson (2008) | |
 Location within the U.S. state of Kansas | |
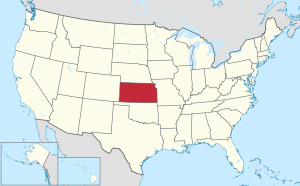
 Kansas's location within the U.S. | |
| Coordinates: 37°57′N 98°05′W / 37.950°N 98.083°W | |
| Country | |
| State | |
| Founded | February 26, 1867 |
| Named for | Jesse Lee Reno |
| Seat | Hutchinson |
| Largest city | Hutchinson |
| Area | |
| • Total | 1,272 sq mi (3,290 km2) |
| • Land | 1,255 sq mi (3,250 km2) |
| • Water | 17 sq mi (40 km2) 1.3% |
| Population | |
| • Total | 61,898 |
| • Density | 49.3/sq mi (19.0/km2) |
| Time zone | UTC−6 (Central) |
| • Summer (DST) | UTC−5 (CDT) |
| Area code | 620 |
| Congressional district | 1st |
| Website | renogov.org |
Reno County (standard abbreviation: RN) is a county in the U.S. state of Kansas. In 2020, 61,898 people lived there.[1] The county seat is Hutchinson. Hutchinson is also the biggest city in Reno County.[2]
History
[change | change source]In 1867, Reno County was created.
In 1887, the Chicago, Kansas and Nebraska Railway built a railroad from Herington to Pratt.[3] This railroad connected Herington, Ramona, Tampa, Durham, Waldeck, Canton, Galva, McPherson, Groveland, Inman, Medora, Hutchinson, Whiteside, Partridge, Arlington, Langdon, Turon, Preston, Natrona, Pratt. In 1888, this main line was extended to Liberal. Later, this railroad was extended to Tucumcari, New Mexico and El Paso, Texas. This railroad is called the "Golden State Limited".
Geography
[change | change source]The U.S. Census Bureau says that the county has a total area of 1,272 square miles (3,290 km2). Of that, 1,255 square miles (3,250 km2) is land and 17 square miles (44 km2) (1.3%) is water.[4] It is the third-biggest county by area in Kansas.
People
[change | change source]| Historical population | |||
|---|---|---|---|
| Census | Pop. | %± | |
| 1880 | 12,826 | — | |
| 1890 | 27,079 | 111.1% | |
| 1900 | 29,027 | 7.2% | |
| 1910 | 37,853 | 30.4% | |
| 1920 | 44,423 | 17.4% | |
| 1930 | 47,785 | 7.6% | |
| 1940 | 52,165 | 9.2% | |
| 1950 | 54,058 | 3.6% | |
| 1960 | 59,055 | 9.2% | |
| 1970 | 60,765 | 2.9% | |
| 1980 | 64,983 | 6.9% | |
| 1990 | 62,389 | −4.0% | |
| 2000 | 64,790 | 3.8% | |
| 2010 | 64,511 | −0.4% | |
| 2020 | 61,898 | −4.1% | |
| U.S. Decennial Census[5] 1790-1960[6] 1900-1990[7] 1990-2000[8] 2010-2020[1] | |||

The Hutchinson Micropolitan Statistical Area includes all of Reno County.
Government
[change | change source]Russell county is almost always Republican. The last time a democratic candidate won the county was in 1976 by Jimmy Carter.
Presidential elections
[change | change source]| Year | Republican | Democratic | Third Parties |
|---|---|---|---|
| 2020 | 65.7% 18,443 | 31.7% 8,886 | 2.6% 731 |
| 2016 | 63.2% 15,513 | 27.9% 6,837 | 8.9% 2,186 |
| 2012 | 64.4% 15,718 | 33.1% 8,085 | 2.5% 619 |
| 2008 | 60.6% 16,112 | 37.3% 9,916 | 2.2% 574 |
| 2004 | 65.0% 17,748 | 33.4% 9,114 | 1.7% 462 |
| 2000 | 59.7% 15,179 | 35.5% 9,025 | 4.8% 1,226 |
| 1996 | 54.3% 14,275 | 34.6% 9,108 | 11.1% 2,917 |
| 1992 | 40.1% 11,377 | 32.6% 9,257 | 27.3% 7,738 |
| 1988 | 51.1% 12,753 | 46.3% 11,545 | 2.6% 656 |
| 1984 | 63.3% 16,568 | 35.3% 9,229 | 1.4% 362 |
| 1980 | 52.9% 13,804 | 36.8% 9,615 | 10.4% 2,702 |
| 1976 | 42.3% 11,212 | 55.1% 14,620 | 2.6% 680 |
| 1972 | 63.8% 15,714 | 33.2% 8,183 | 3.0% 731 |
| 1968 | 50.3% 11,804 | 42.1% 9,872 | 7.7% 1,798 |
| 1964 | 36.8% 8,829 | 62.3% 14,936 | 0.9% 208 |
| 1960 | 60.2% 14,655 | 39.3% 9,557 | 0.5% 127 |
| 1956 | 66.6% 15,057 | 33.0% 7,461 | 0.5% 102 |
| 1952 | 68.6% 15,762 | 28.5% 6,555 | 2.9% 666 |
| 1948 | 51.9% 11,187 | 46.2% 9,957 | 2.0% 423 |
| 1944 | 58.7% 11,004 | 40.6% 7,604 | 0.7% 135 |
| 1940 | 53.6% 12,448 | 45.4% 10,543 | 0.9% 217 |
| 1936 | 37.6% 8,607 | 62.0% 14,203 | 0.4% 88 |
| 1932 | 47.3% 8,972 | 49.3% 9,351 | 3.4% 647 |
| 1928 | 76.3% 12,872 | 22.8% 3,843 | 0.9% 153 |
| 1924 | 65.2% 10,339 | 23.2% 3,675 | 11.6% 1,837 |
| 1920 | 67.1% 9,649 | 30.5% 4,385 | 2.4% 341 |
| 1916 | 46.1% 6,870 | 44.8% 6,683 | 9.2% 1,366 |
| 1912 | 20.9% 1,668 | 42.1% 3,360 | 37.0% 2,947 |
| 1908 | 52.7% 4,092 | 43.6% 3,381 | 3.7% 289 |
| 1904 | 69.3% 4,245 | 23.2% 1,423 | 7.4% 455 |
| 1900 | 56.0% 3,769 | 42.5% 2,859 | 1.5% 100 |
| 1896 | 52.0% 3,373 | 47.0% 3,051 | 1.0% 67 |
| 1892 | 50.0% 3,166 | 50.0% 3,166[a] | |
| 1888 | 56.6% 3,398 | 30.7% 1,841 | 12.7% 763 |
Education
[change | change source]Unified school districts
[change | change source]- USD 308 Hutchinson
- USD 309 Nickerson - South Hutchinson
- USD 310 Fairfield
- USD 311 Pretty Prairie
- USD 312 Haven
- USD 313 Buhler Archived 2016-11-30 at the Wayback Machine
- USD 369 Burrton
Communities
[change | change source]
Cities
[change | change source]References
[change | change source]- ↑ 1.0 1.1 1.2 "QuickFacts: Reno County, Kansas". United States Census Bureau. Retrieved October 3, 2023.
- ↑ "Find a County". National Association of Counties. Retrieved 2011-06-07.
- ↑ "Rock Island Rail History". Archived from the original on 2011-06-19. Retrieved 2019-07-26.
- ↑ "US Gazetteer files: 2010, 2000, and 1990". United States Census Bureau. 2011-02-12. Retrieved 2011-04-23.
- ↑ "U.S. Decennial Census". United States Census Bureau. Retrieved July 28, 2014.
- ↑ "Historical Census Browser". University of Virginia Library. Archived from the original on August 11, 2012. Retrieved July 28, 2014.
- ↑ "Population of Counties by Decennial Census: 1900 to 1990". United States Census Bureau. Retrieved July 28, 2014.
- ↑ "Census 2000 PHC-T-4. Ranking Tables for Counties: 1990 and 2000" (PDF). United States Census Bureau. Retrieved July 28, 2014.
- ↑ "Dave Leip's Atlas of U.S. Presidential Elections".
- Notes
- ↑ This total comprises 3,097 votes (48.9%) were for Populist James B. Weaver (who was supported by the state’s Democrats) and 69 (1.1%) for Prohibition Party candidate John Bidwell.
More reading
[change | change source]- History of Reno County, Kansas : Its People, Industries, and Institutions; 2 Volumes; Sheridan Ploughe; Bowen and Company; 445 / 959 pages; 1917. (Volume1 - Download 19MB PDF eBook), (Volume2 - Download 32MB PDF eBook)
- Standard Atlas of Reno County, Kansas; Geo. A. Ogle & Co; 110 pages; 1918.
- Plat Book of Reno County, Kansas; Hutchinson Blue Print Co; 61 pages; 1912.
- Plat Book of Reno County, Kansas; North West Publishing Co; 77 pages; 1902.
Other websites
[change | change source]- County
- Other
- Maps

